RGB Matrix Audio Visualizer with Arduino
In this project I built an RGB LED matrix audio visualizer, using an Arduino, an RGB LED Matrix Shield, and an Audio Spectrum Analyzer Shield, then put it in an enclosure so that you can have a finished project that you can display by your music system to have a nice light show of your music!
 For the Audio Spectrum Analysis, I use SparkFun's Spectrum Shield, that uses two MSGEQ7 graphic equalizer display filters, that split a stereo audio input into 7-bands (per channel) and read the amplitude of each using the ADC on your Arduino. It comes with Arduino sample sketches to get started.
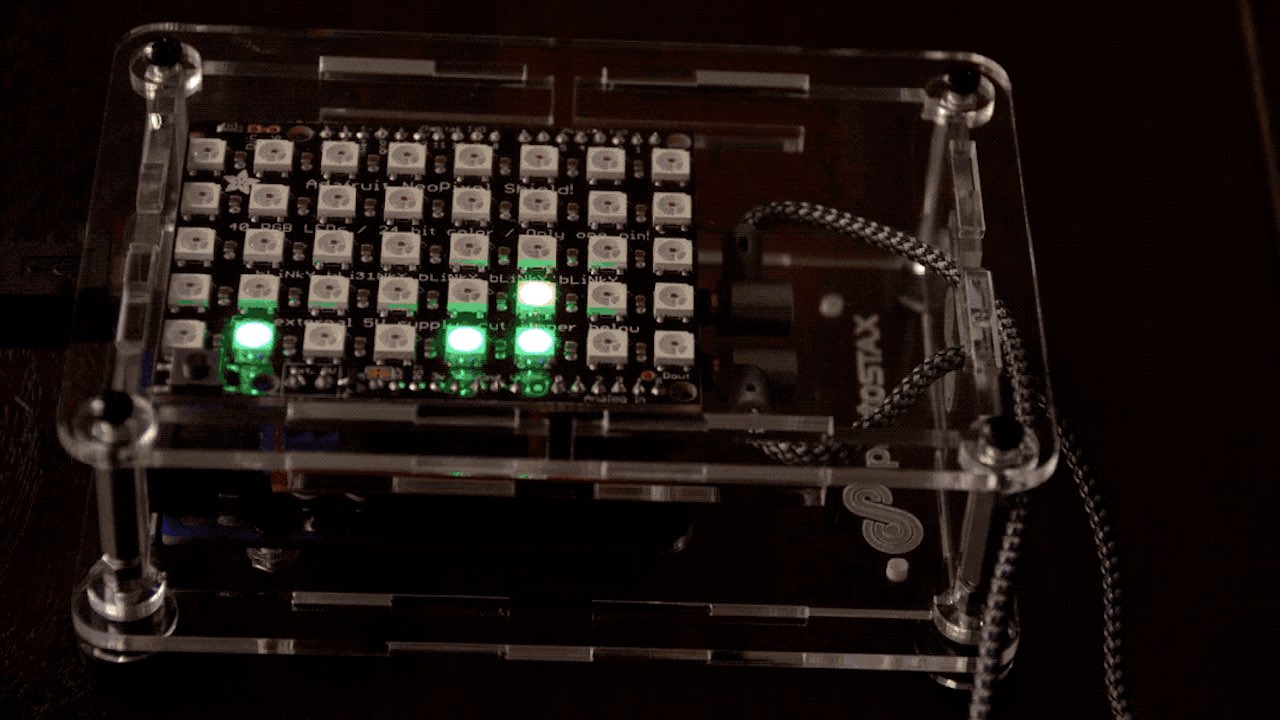
For the RGB LED Matrix, I use Adafruit's NeoPixel Shield for Arduino, that consists of 40 RGB NeoPixels (Adafruit's terminology for their WS2812 light source). Red, green and blue LEDs are integrated alongside a driver chip into a tiny surface-mount package controlled through a single wire. They can be used individually, chained into longer strings or assembled into still more interesting form-factors. In the case of the Shield, they are chained together. The Shield also comes with the Adafruit_NeoMatrix library, that simplifies access to the RGB LED Matrix and controlling the LEDs.
Lastly comes the enclosure. Some of you may be aware that I created a stackable, modular enclosure system called ProtoStax. It was a personal itch that I had to scratch - I wanted an enclosure that supported different stages of prototyping, offering protection and open access when starting out, with the ability to add side walls and the top later, but also have the ability to stack multiple units either side-by-side or one on top of the other, thereby having the ability to expand with prototyping needs and the addition of other boards and components.
In this example I use ProtoStax for Arduino, a clear acrylic enclosure for the Arduino -- it fits both the Uno/Leonardo footprint as well as the larger Mega/Due footprint -- that is also stackable and modular and has room comfortably for the two Shields (with some minor modifications, that I outline in the project). It is clear and sturdy and also has rubber feet to slightly elevate it and protect the surface of your table, so you can display your Audio Visualizer and its light show along with your music system! 😊
The code analyses the frequency spread of the audio input into 7 buckets. It then graphs the frequencies onto the RGB LED Matrix (8x5) using 7x5 and using the 5 column to represent the amplitude.
The frequencies are split into 3 bands and it is possible to assign a color scheme for each band. There are 3 such color schemes - one that uses green to red/pink range for display from lowest amplitude to highest, and the other that uses a more pink/blue shifted range. The 3rd scheme uses the same color for all pixels, but cycles through the whole color wheel as it goes along.